Al Gore predicted the Arctic ice cap could completely disappear by 2014.
Please click here to see how wrong he was!
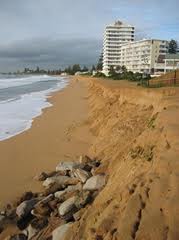
There is no fear of any massive flooding!
 dropped for a period in the mid-to-late 1990s.
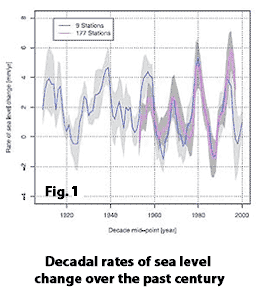
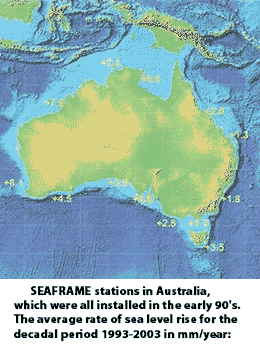 All the stations in this study show a significant increase in sea level over the period 1904 - 2003 with an average increase of 174 mm during that time. This mean rate of 1.74 mm/yr is at
Figure 1 (left) shows decadal rates of sea level change over the past century. All rates are corrected for glacial isostatic adjustment and inverse barometer effects. The shaded region indicates +/- 1
standard error (from Holgate, 2007) and the two highest decadal rates of change were recorded in the decades
centered on 1980 (5.31 mm/year) and 1939 (4.68 mm/year) with the most negative decadal rates
of change over the past 100 years during the decades
centered on 1964 (-1.49 mm/year) and 1987 (-1.33 mm/year).
The greatest global sea level rise occurred around 1980, well before the greenhouse scare got off the ground. Nils-Axel Moerner, former head of the Paleogeophysics and Geodynamics department at Stockholm
University, who has devoted his entire professional life to the study of the topic, applies
all "observational material[s] and theoretical consideration[s] for a sound estimation of the sea level changes
to be expected in the near future, noting that his analysis "is a contribution of the INQUA Commission on Sea level Changes and Coastal Evolution, and can be regarded as the commission's official
evaluation of the sea level changes that are to be expected in the near-future."
Writing on behalf of the INQUA Commission on Sea Level Changes and Coastal Evolution, Moerner says: ... when we consider past records, recorded variability, causational processes involved and the last centuries'
data, our best estimate of possible future sea level changes is +10 +/- 10 cm in a century or, maybe, even +5 +/- 15 cm ... Hence, in his words: ... we have to discard the model output of IPCC (2001) as untenable,
not to say impossible (Moerner, 1995; INQUA, 2000), and we cite the Gilgamesh Epos from about 5000 BP saying: Lay upon the sinner his sin. Lay upon the transgressioner his transgression ...
Or to put it more bluntly, as Moerner does in the final sentence of his abstract: ...there is no fear of any massive future flooding as claimed in most global warming scenarios ...
The Poles
All the stations in this study show a significant increase in sea level over the period 1904 - 2003 with an average increase of 174 mm during that time. This mean rate of 1.74 mm/yr is at
Figure 1 (left) shows decadal rates of sea level change over the past century. All rates are corrected for glacial isostatic adjustment and inverse barometer effects. The shaded region indicates +/- 1
standard error (from Holgate, 2007) and the two highest decadal rates of change were recorded in the decades
centered on 1980 (5.31 mm/year) and 1939 (4.68 mm/year) with the most negative decadal rates
of change over the past 100 years during the decades
centered on 1964 (-1.49 mm/year) and 1987 (-1.33 mm/year).
The greatest global sea level rise occurred around 1980, well before the greenhouse scare got off the ground. Nils-Axel Moerner, former head of the Paleogeophysics and Geodynamics department at Stockholm
University, who has devoted his entire professional life to the study of the topic, applies
all "observational material[s] and theoretical consideration[s] for a sound estimation of the sea level changes
to be expected in the near future, noting that his analysis "is a contribution of the INQUA Commission on Sea level Changes and Coastal Evolution, and can be regarded as the commission's official
evaluation of the sea level changes that are to be expected in the near-future."
Writing on behalf of the INQUA Commission on Sea Level Changes and Coastal Evolution, Moerner says: ... when we consider past records, recorded variability, causational processes involved and the last centuries'
data, our best estimate of possible future sea level changes is +10 +/- 10 cm in a century or, maybe, even +5 +/- 15 cm ... Hence, in his words: ... we have to discard the model output of IPCC (2001) as untenable,
not to say impossible (Moerner, 1995; INQUA, 2000), and we cite the Gilgamesh Epos from about 5000 BP saying: Lay upon the sinner his sin. Lay upon the transgressioner his transgression ...
Or to put it more bluntly, as Moerner does in the final sentence of his abstract: ...there is no fear of any massive future flooding as claimed in most global warming scenarios ...
The Poles
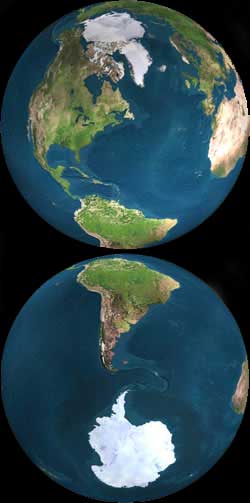 The ice sheets of Antarctica (South Pole) and Greenland, represents approximately 99.5% of the total ice sheet surface of the earth. The Arctic ice is floating sea ice on the Arctic Ocean in contrast to
the inland ice of Greenland and Antarctica. The Arctic Ocean including its ice cover plays a significant part in the global heat balance.
The interrelation is demonstrated by the Arctic Ocean Model: If the Arctic Ocean is frozen, as it is at present, the evaporation of water into the atmosphere and its precipitation as snow is gradually
reduced. Diminished snow fall prevents the ice mass to be replenish and consequently the Arctic ice cap is shrinking. This causal chain is probably the reason for the current situation.
If the ice cap melts and if the earth warms, the Arctic Ocean opens again. More radiation can be absorbed and the temperature continues to rise (= albedo / temperature feedback loop). At some point,
there is sufficient water for evaporation, and because the water comes back again as snow, the ice sheet expands again. This allows more heat radiation reflecting back from the icy surface, which reduces the
temperature. So a new cycle begins and a new ice age. Over the last 200 years the temperature had dropped off two times over several decades by about 0.5 degrees C, however the CO2 concentration went up.
Since 1950, the temperature of the Arctic dropped till today by about 0.4 degrees C.
Greenland
The ice sheets of Antarctica (South Pole) and Greenland, represents approximately 99.5% of the total ice sheet surface of the earth. The Arctic ice is floating sea ice on the Arctic Ocean in contrast to
the inland ice of Greenland and Antarctica. The Arctic Ocean including its ice cover plays a significant part in the global heat balance.
The interrelation is demonstrated by the Arctic Ocean Model: If the Arctic Ocean is frozen, as it is at present, the evaporation of water into the atmosphere and its precipitation as snow is gradually
reduced. Diminished snow fall prevents the ice mass to be replenish and consequently the Arctic ice cap is shrinking. This causal chain is probably the reason for the current situation.
If the ice cap melts and if the earth warms, the Arctic Ocean opens again. More radiation can be absorbed and the temperature continues to rise (= albedo / temperature feedback loop). At some point,
there is sufficient water for evaporation, and because the water comes back again as snow, the ice sheet expands again. This allows more heat radiation reflecting back from the icy surface, which reduces the
temperature. So a new cycle begins and a new ice age. Over the last 200 years the temperature had dropped off two times over several decades by about 0.5 degrees C, however the CO2 concentration went up.
Since 1950, the temperature of the Arctic dropped till today by about 0.4 degrees C.
Greenland
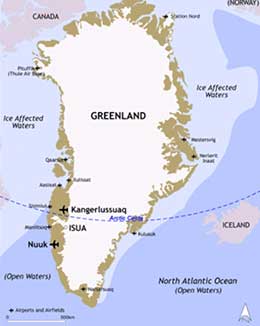 Greenland is the largest island in the world. Its northerly location, at the point where the Atlantic meets the Arctic Ocean, means that Greenland is surrounded principally by cold ocean currents,
so the coasts are constantly being cooled. This, combined with the radiation of cold from the inland ice, gives Greenland its arctic climate. The ice cap or inland ice covers 1,833,900 square km,
equivalent to 85 percent of Greenland's total area, and extends 2,500 km (1,553 miles) from north to south and up to 1,000 km from east to west.
The land ice sheet of Greenland is approximately 10% of the total ice sheet surface on earth. Several factors determine the net rate of growth or decline of the ice sheet. These are:
1. Accumulation of snow in the central parts
2. Melting of ice along the sheet's margins (runoff) and bottom
3. Iceberg calving into the sea from outlet glaciers also along the sheet's edges
The last Intergovernmental Panel on Climate Change (IPCC) report (4th edition) did not include estimates about sea level contributions from Greenland due to lack of data. This will cause a 'boom' of
researchers to go to the area to look at the problem. Atkins et al. didn't find any change in ice mass since 1993 on Greenland. Other researchers as one can read e.g. in Geophysical Research Letters,
came to the conclusion that the ice sheet of West Greenland has grown thicker by more than 20 cm since 1980. Alley et al. says in a study in Science 2005 that the Greenland ice sheet will melt completely
due to global warming. They found a net ice mass loss e.g. between 1993-94 and 98/99 of 54 GT / year.
Exactly the opposite noted Johannessen et al. in ScienceExpress. Johannessen proves that the use of sampling methods gives misleading results and he worked out a satellite-based ice thickness analysis for
the whole of Greenland and for 11 years (1992-2003). Result: Below 1500 m height a decrease in ice cover by 2 cm / year and above 1500 meters an increase of 6.4 cm / year occurred. That means an average over
all of Greenland an increase of 5.5 cm / year!
According to the 2007 report from the IPCC, it is hard to measure the mass balance precisely, but most results indicate accelerating mass loss from Greenland during the 1990s up to 2005. Assessment
of the data and techniques suggests a mass balance for the Greenland Ice Sheet ranging between growth of 25 Gt/year and loss of 60 Gt/year for 1961 to 2003, loss of 50 to 100 Gt/year for 1993 to 2003
and loss at even higher rates between 2003 and 2005. A paper on Greenland's temperature record shows that the warmest year on record was 1941 while the warmest decades were the 1930s and 1940s. The data
used was from stations on the south and west coasts, most of which did not operate continuously the entire study period. While Arctic temperatures have generally increased, there is some discussion over
the temperatures over Greenland. First of all, Arctic temperatures are highly variable, making it difficult to discern clear trends at a local level. Also, until recently, an area in the North Atlantic
including southern Greenland was one of the only areas in the World showing cooling rather than warming in recent decades, but this cooling has now been replaced by strong warming in the period 1979 - 2005.
Antarctica
Greenland is the largest island in the world. Its northerly location, at the point where the Atlantic meets the Arctic Ocean, means that Greenland is surrounded principally by cold ocean currents,
so the coasts are constantly being cooled. This, combined with the radiation of cold from the inland ice, gives Greenland its arctic climate. The ice cap or inland ice covers 1,833,900 square km,
equivalent to 85 percent of Greenland's total area, and extends 2,500 km (1,553 miles) from north to south and up to 1,000 km from east to west.
The land ice sheet of Greenland is approximately 10% of the total ice sheet surface on earth. Several factors determine the net rate of growth or decline of the ice sheet. These are:
1. Accumulation of snow in the central parts
2. Melting of ice along the sheet's margins (runoff) and bottom
3. Iceberg calving into the sea from outlet glaciers also along the sheet's edges
The last Intergovernmental Panel on Climate Change (IPCC) report (4th edition) did not include estimates about sea level contributions from Greenland due to lack of data. This will cause a 'boom' of
researchers to go to the area to look at the problem. Atkins et al. didn't find any change in ice mass since 1993 on Greenland. Other researchers as one can read e.g. in Geophysical Research Letters,
came to the conclusion that the ice sheet of West Greenland has grown thicker by more than 20 cm since 1980. Alley et al. says in a study in Science 2005 that the Greenland ice sheet will melt completely
due to global warming. They found a net ice mass loss e.g. between 1993-94 and 98/99 of 54 GT / year.
Exactly the opposite noted Johannessen et al. in ScienceExpress. Johannessen proves that the use of sampling methods gives misleading results and he worked out a satellite-based ice thickness analysis for
the whole of Greenland and for 11 years (1992-2003). Result: Below 1500 m height a decrease in ice cover by 2 cm / year and above 1500 meters an increase of 6.4 cm / year occurred. That means an average over
all of Greenland an increase of 5.5 cm / year!
According to the 2007 report from the IPCC, it is hard to measure the mass balance precisely, but most results indicate accelerating mass loss from Greenland during the 1990s up to 2005. Assessment
of the data and techniques suggests a mass balance for the Greenland Ice Sheet ranging between growth of 25 Gt/year and loss of 60 Gt/year for 1961 to 2003, loss of 50 to 100 Gt/year for 1993 to 2003
and loss at even higher rates between 2003 and 2005. A paper on Greenland's temperature record shows that the warmest year on record was 1941 while the warmest decades were the 1930s and 1940s. The data
used was from stations on the south and west coasts, most of which did not operate continuously the entire study period. While Arctic temperatures have generally increased, there is some discussion over
the temperatures over Greenland. First of all, Arctic temperatures are highly variable, making it difficult to discern clear trends at a local level. Also, until recently, an area in the North Atlantic
including southern Greenland was one of the only areas in the World showing cooling rather than warming in recent decades, but this cooling has now been replaced by strong warming in the period 1979 - 2005.
Antarctica
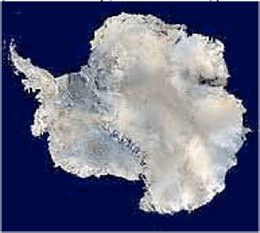 The Antarctic ice sheet covers about 98% of the Antarctic continent and is the largest single mass of ice on Earth. It covers an area of almost 14 million square km and contains 30 million cubic km of ice.
That is, approximately 61 percent of all fresh water on the Earth is held in the Antarctic ice sheet, an amount equivalent to 70 m of water in the world's oceans. In East Antarctica, the
ice sheet rests on a major land mass, but in West Antarctica the bed can extend to more than 2,500 m below sea level. The land in this area would be seabed if the ice sheet were not there.
Ice enters the sheet through precipitation as snow. This snow is then compacted to form glacier ice which moves under gravity towards the coast. Most of it is carried to the coast by fast moving ice streams.
The ice then passes into the ocean, often forming vast floating ice shelves. These shelves then melt or calve off to give icebergs that eventually melt.
If the transfer of the ice from the land to the sea is balanced by snow falling back on the land then there will be no net contribution to global sea levels. A 2002 analysis of NASA satellite data from
1979-1999 showed that areas of Antarctica where ice was increasing outnumbered areas of decreasing ice roughly 2:1. The general trend shows that a warming climate in the southern hemisphere would transport
more moisture to Antarctica, causing the interior ice sheets to grow, while calving events along the coast will increase, causing these areas to shrink. Another recent study compared the ice leaving the
ice sheet, by measuring the ice velocity and thickness along the coast, to the amount of snow accumulation over the continent. This found that the East Antarctic Ice Sheet was in balance but the West
Antarctic Ice Sheet was losing mass. This was largely due to acceleration of ice streams such as Pine Island Glacier. These results agree closely with the gravity changes.
Glaciers
The Antarctic ice sheet covers about 98% of the Antarctic continent and is the largest single mass of ice on Earth. It covers an area of almost 14 million square km and contains 30 million cubic km of ice.
That is, approximately 61 percent of all fresh water on the Earth is held in the Antarctic ice sheet, an amount equivalent to 70 m of water in the world's oceans. In East Antarctica, the
ice sheet rests on a major land mass, but in West Antarctica the bed can extend to more than 2,500 m below sea level. The land in this area would be seabed if the ice sheet were not there.
Ice enters the sheet through precipitation as snow. This snow is then compacted to form glacier ice which moves under gravity towards the coast. Most of it is carried to the coast by fast moving ice streams.
The ice then passes into the ocean, often forming vast floating ice shelves. These shelves then melt or calve off to give icebergs that eventually melt.
If the transfer of the ice from the land to the sea is balanced by snow falling back on the land then there will be no net contribution to global sea levels. A 2002 analysis of NASA satellite data from
1979-1999 showed that areas of Antarctica where ice was increasing outnumbered areas of decreasing ice roughly 2:1. The general trend shows that a warming climate in the southern hemisphere would transport
more moisture to Antarctica, causing the interior ice sheets to grow, while calving events along the coast will increase, causing these areas to shrink. Another recent study compared the ice leaving the
ice sheet, by measuring the ice velocity and thickness along the coast, to the amount of snow accumulation over the continent. This found that the East Antarctic Ice Sheet was in balance but the West
Antarctic Ice Sheet was losing mass. This was largely due to acceleration of ice streams such as Pine Island Glacier. These results agree closely with the gravity changes.
Glaciers
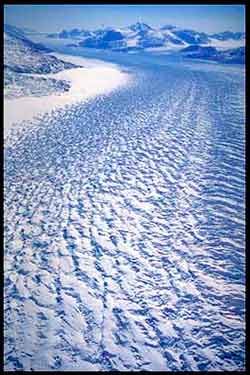 The new still tentative data of more than 80 glaciers confirm the global trend of fast ice loss since 1980. Glaciers with long-term observation series (30 glaciers in 9 mountain ranges) have experienced
a reduction in total thickness of more than 11 m w.e. until 2007. The average annual ice loss during 1980-1999 was roughly 0.3 m w.e. per year. Since 2000, this rate has increased to about 0.7 m w.e. per
year. The average ice loss in 2007 was not as extreme as in 2006, but there were large differences between mountain ranges. Glaciers in the European Alps lost up to 2.5 meters water equivalent of ice,
whereas maritime glaciers in Scandinavia were able to gain more than a meter in thickness. However, 2007 is now the sixth year of this century in which the average ice loss of the reference glaciers has
exceeded half a meter. This has resulted in a more than doubling of the melt rates of the 1980s and 90s.
If the increased activity we are seeing today is something really dramatic and unique that has never happened before - and therefore can be really catastrophic - or really just the natural ebb and flow
of the glaciers can only be established by long-term measurement series of glacier mass balance. We still know too little about the current state of glaciers throughout the earth. For the approximately 160,
000 glaciers on earth only 67,000 (= 42%) were subject to a mass balance. For about 200 glaciers only a 1-year, for 115 a 5 years plus and only for 42 glaciers for over 10 years (0,026%)! a mass balance
was produced. An overview of the state (mass balance) of 246 glaciers between 1946 and 1995, was introduced by RJ Braithwaite in 2002. According to that the author demonstrates that there is no global trend
to the melting of the glacier mass balance in the first 50 years of international monitoring (Progress in Physical Geography 26: 76-95). Set side by side the glaciers are developing locally different.
Within Europe, the Alpine glaciers are shrinking, the Scandinavian ice sheet are expanding and the Caucasian glaciers have remained stable. During the year 2006, with the coldest winter since the
temperature record in New Zealand and Australia, it was found that all the glaciers in this region grow again after their mass shrunk since the Little Ice Age.
The new still tentative data of more than 80 glaciers confirm the global trend of fast ice loss since 1980. Glaciers with long-term observation series (30 glaciers in 9 mountain ranges) have experienced
a reduction in total thickness of more than 11 m w.e. until 2007. The average annual ice loss during 1980-1999 was roughly 0.3 m w.e. per year. Since 2000, this rate has increased to about 0.7 m w.e. per
year. The average ice loss in 2007 was not as extreme as in 2006, but there were large differences between mountain ranges. Glaciers in the European Alps lost up to 2.5 meters water equivalent of ice,
whereas maritime glaciers in Scandinavia were able to gain more than a meter in thickness. However, 2007 is now the sixth year of this century in which the average ice loss of the reference glaciers has
exceeded half a meter. This has resulted in a more than doubling of the melt rates of the 1980s and 90s.
If the increased activity we are seeing today is something really dramatic and unique that has never happened before - and therefore can be really catastrophic - or really just the natural ebb and flow
of the glaciers can only be established by long-term measurement series of glacier mass balance. We still know too little about the current state of glaciers throughout the earth. For the approximately 160,
000 glaciers on earth only 67,000 (= 42%) were subject to a mass balance. For about 200 glaciers only a 1-year, for 115 a 5 years plus and only for 42 glaciers for over 10 years (0,026%)! a mass balance
was produced. An overview of the state (mass balance) of 246 glaciers between 1946 and 1995, was introduced by RJ Braithwaite in 2002. According to that the author demonstrates that there is no global trend
to the melting of the glacier mass balance in the first 50 years of international monitoring (Progress in Physical Geography 26: 76-95). Set side by side the glaciers are developing locally different.
Within Europe, the Alpine glaciers are shrinking, the Scandinavian ice sheet are expanding and the Caucasian glaciers have remained stable. During the year 2006, with the coldest winter since the
temperature record in New Zealand and Australia, it was found that all the glaciers in this region grow again after their mass shrunk since the Little Ice Age.
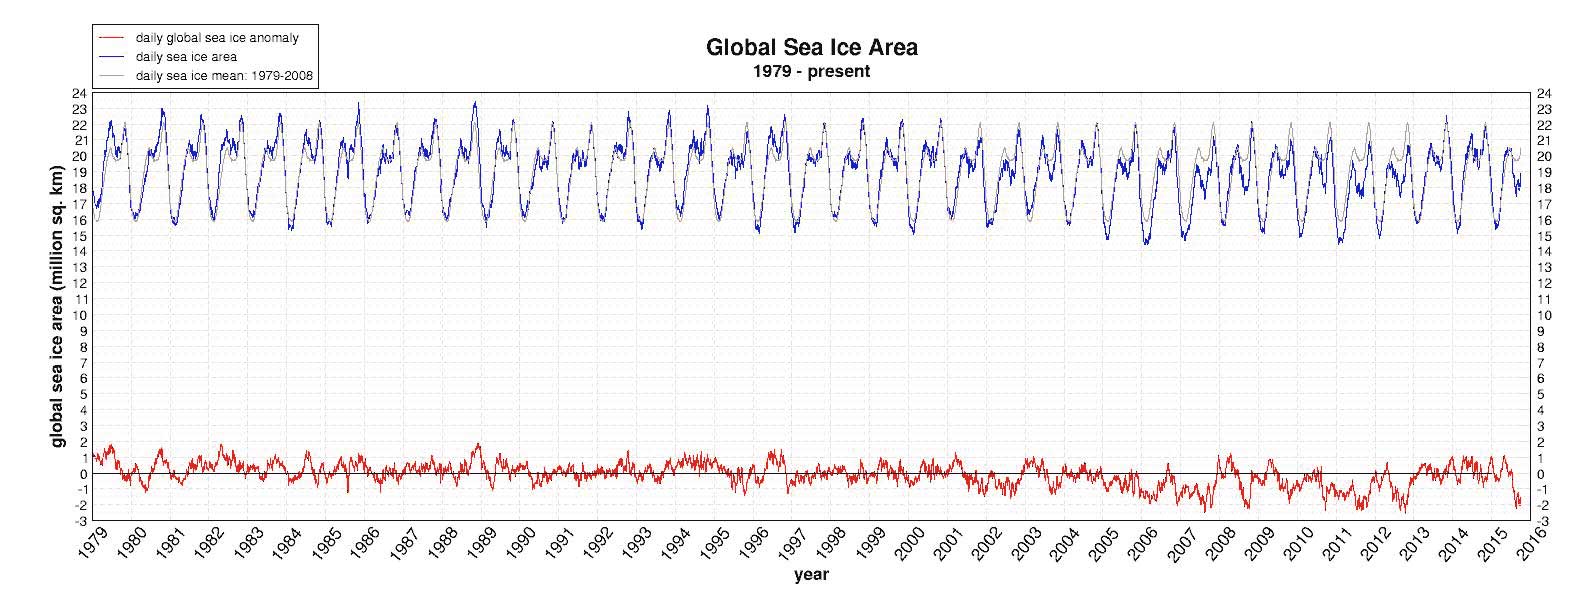 By 2012, polar sea ice had receded by approximately 10 percent from 1979 measurements. The 1979 NASA satellite instrument launch could not have been better for global warming alarmists because the late 1970s
coincided with the end of a 30-year cooling trend. Alarmists focused on the sea ice loss as “proof” of a global warming crisis. In late 2012, however, polar ice dramatically rebounded and quickly surpassed the
post-1979 average. Ever since, the polar ice caps have been at a greater average extent than the post-1979 mean.
By 2012, polar sea ice had receded by approximately 10 percent from 1979 measurements. The 1979 NASA satellite instrument launch could not have been better for global warming alarmists because the late 1970s
coincided with the end of a 30-year cooling trend. Alarmists focused on the sea ice loss as “proof” of a global warming crisis. In late 2012, however, polar ice dramatically rebounded and quickly surpassed the
post-1979 average. Ever since, the polar ice caps have been at a greater average extent than the post-1979 mean.