The Mother of Historical Science Distortion
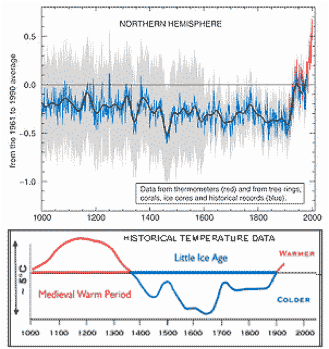
The rather simple looking graph above represents the historical distortion of the decade by Dr. Michael Mann - Director, Earth System Science Centre, Pennsylvania State University - one of the leading authors of the
United Nations' Intergovernmental Panel on Climate Change (IPCC) Third Assessment Report (TAR) of 2001.
The graph above depicts averaged Northern Hemisphere temperatures over the last thousand years. More than that, in global climate reports particularly it's used as proof that mankind's industrial revolution has over the last hundred years started dangerously pushing up global temperatures, thus justifying restrictions on emissions of human produced greenhouse gasses. In this graph the historically documented temperature variations of the last millennium were flattened to a straight line due to statistical errors and improper calibration of the data right through to the 19 Century. Thermometer readings were not available for almost 850 of the 1,000 years.

Therefore Mann et al. used tree-growth rings, coral and ice core records from about 105 sites across the globe. To verify the accuracy of the temperature data derived from those proxies, the methodology of the studies tested more recent proxy data to see if it fit the available geographical patterns of temperature observed by available thermometer measurements for the last 80-150 years or so. Those proxies that did not fit the pattern were essentially ignored. For those that did, it was assumed that the same geographical pattern of change seen in the very short period with thermometer records would hold true for the full 1,000 years into the past. In order to demonstrate the consequences of the "statistical errors" involved, the true historical temperature trend development is shown above (Above Fig. below the artefact).